Market Statistics
Total S&box market cap, trading activity, top movers, and market share.
Market Cap
$3,159,316
-0.19%24h
24h Volume
$1,030
465 units traded
Avg Trade (24h)
$2.21
Unique Items: 110
Turnover Rate (7d)
0.4%
2.5K traded / 645.1K supply
Market Cap & Volume
Hourly market cap (line) and volume (bars).
Limited Best Sellers
Active limited items with the highest net sales.
| Item | Time Left | Trend | ||||
|---|---|---|---|---|---|---|
 | Captive Clicker Ring Silver | 924 | 924 | 154 | 2d | |
 | Black Teashade Sunglasses | 749 | 749 | 125 | 2d | |
 | Referee Shirt | 431 | 431 | 72 | 2d | |
 | Checkered Commuters | 393 | 393 | 66 | 2d |
Top Gainers (24h)

Top Losers (24h)


Most Active (24h)


Most Expensive Purchases (30d)

Highest Demand


Market Share
Top items by volume over 30 days.
Overall (30d)
1.  Cardboard King$11,04712.5%
 2.  Face Tattoos$5,6706.4%
 3. 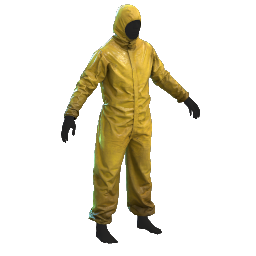 Scientist Hazmat Yellow$4,9255.6%
 4. 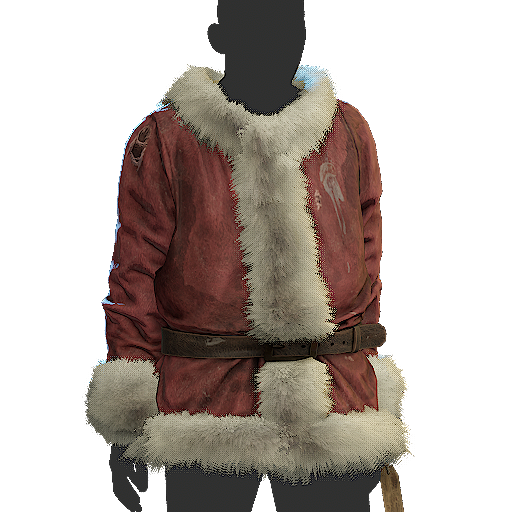 Santa 2024 Jacket$4,5825.2%
 5.  Neck Tattoo$3,9594.5%
6. 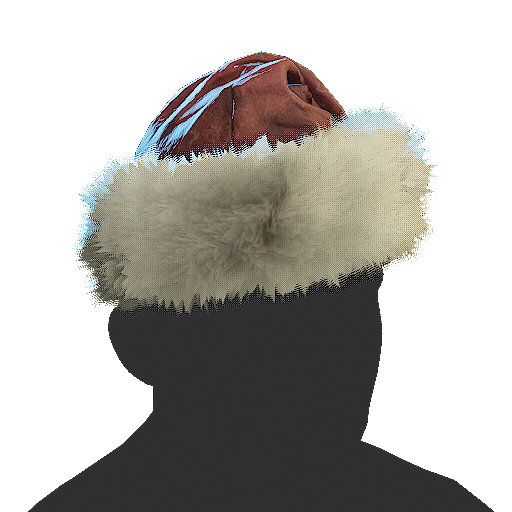 Santa 2024 Hat$3,8224.3%
 7. 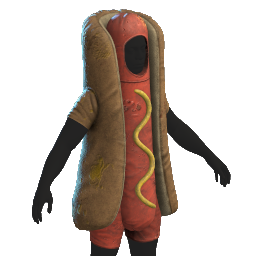 The Hotdog Costume$3,2033.6%
 8.  Skull Helmet$2,6203.0%
 9. 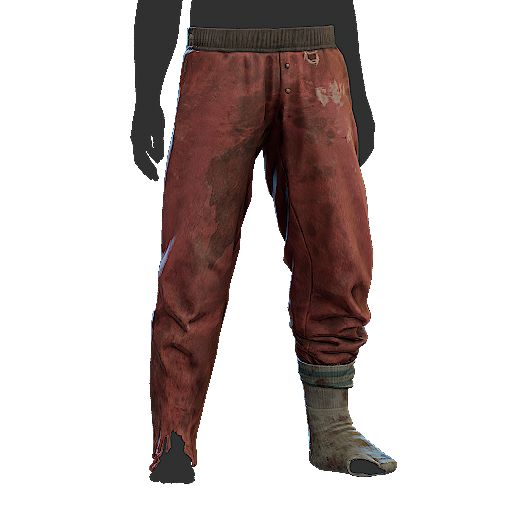 Santa Trousers 2024$2,1382.4%
 - 10. Others$46,62352.6%
Understanding the S&box market
This page is a live overview of the entire S&box economy on the Steam Community Market. It tracks the total S&box market cap, 24-hour and 7-day trading volume, average trade size, turnover rate, and the full historical market cap and volume curve so you can see how the market has grown over time. Use it to gauge whether the S&box market is heating up or cooling off, and which items are leading the move.
▶ Learn more
Top Gainers, Losers & Most Active S&box Items
Spot the biggest 24-hour S&box price swings at a glance. The gainers and losers boards highlight the items with the largest percentage moves, while the most-active board shows the items with the highest trading volume — the skins everyone is buying, selling, and talking about right now. Click any row to jump to its full price history page.
Limited Best Sellers & In-Game Store Pressure
The limited best sellers panel tracks which items are selling fastest from the in-game S&box store before they're removed from sale. Each row shows units sold over the last 7 days and countdown time remaining — useful for catching a rare drop before supply closes, or anticipating which limited skins will spike on the secondary market once the store window ends.
Highest Demand & Supply Orders
See where the deepest buy and sell pressure is concentrated across the entire S&box market. Highest-demand orders show the biggest open buy walls (where players are willing to spend), and highest-supply orders show the biggest sell walls (where listings are stacked). Combined with most-expensive recent purchases, this gives you a real read on where serious money is moving in the S&box market.
Market Share by Item
The market share breakdown ranks every S&box item by its share of total 30-day trading volume — in dollars or units. It's the fastest way to understand which skins, cosmetics, and limited drops actually dominate the S&box economy versus which are long-tail. Compare your favorite items against the wider market and see how concentration shifts week over week.
Market Cap, Volume & Holder Data
All numbers on this page are computed from live Steam Community Market data refreshed hourly. To dig deeper on any item, open its detail page for full price history, order book depth, holders, community sentiment, and peer-to-peer trade offers. Or sign in with Steam to track your own S&box inventory value against these market trends.